Update: I have added an update to the bottom of this blog post.
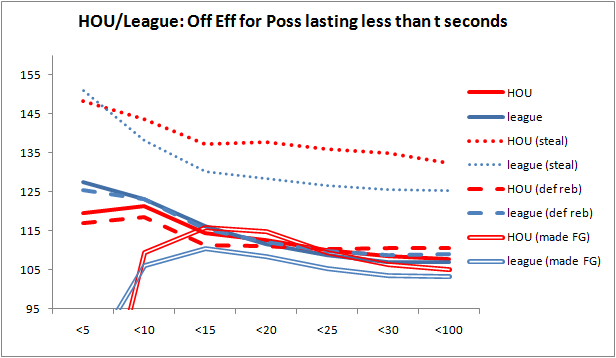
Just to recap, in my first post I looked at individual box score stats for players within the first 7 seconds of possessions. This gave me an idea of which players are most involved offensively during fast breaks, though I didn’t distinguish plays which may have evolved early in a possession but were not technically fast breaks (e.g., an out-of-bounds play out of a timeout). In my second post, I tried to show how pace for the Houston Rockets fluctuates over the course of the game, and how this relates to various players being on the floor (in particular, the PGs). I used two metrics to assess “pace’ — time per possession and time to first shot, drawn foul, or turnover per possession. To get a better understanding of how the up-tempo attack is being used for the Rockets benefit, I wanted to take a closer look at how frequently the Rockets get the shorter possessions vs the longer possessions, and also how their efficiency relates to this. Again using the play-by-play data from Basketball Geek, I recorded both the duration of each possession and also possession triggers or events that started a possession. This allowed me, for instance, to distinguish possessions triggered by a steal, by a defensive rebound, or by a made field goal (amongst other possible events). I also recorded how many points were scored on each possession (ignoring technicals foul shots) to determine offensive efficiency. As I did this for every possession played this season across all games, I can compare the way in which the Rockets use their possessions to other teams or the league average. In the graph below, I’ve shown the percentage of possessions lasting less than t seconds given various possession triggers. I thought this graphical representation would be interesting because, before, I looked only at the average duration of possessions. Here, we can visualize it more as a distribution. I’ve also shown the data for the league as a whole, for comparison. The solid lines are percentages for all offensive possessions, while the other lines represent possession after particular triggers. Note that overall, the Rockets are almost exactly at league average (the solid red and blue lines overlap), though the Rockets are one of the best offensive rebounding teams (which will have the effect of extending possessions). I haven’t shown it here, but my guess is that if I plot a similar graph for time to first shot, drawn foul, or turnover, it will show the Rockets to be getting into their offense faster than league average. In the next graph, I show offensive efficiency for possessions lasting less than t seconds. Overall, the Rockets do appear to be close to league average, though they tend not to be as efficient in possessions lasting under 15 seconds. By looking at the lines for the particular possession triggers, I find that what’s contributing to this overall subpar efficiency on short possessions is the performance after defensive rebounds (the dashed lines). It is possible that the Rockets lack of a great defensive rebounding presence (with all due to respect to Luis Scola) limits their ability to get easy scores in transition off FG misses. It is evident here that the Rockets have done an excellent job in capitalizing off of their steals, with an offensive efficiency nearly 10 points higher than league average overall. Trevor Ariza, for all his faults on the offensive side, has contributed significantly in this respect.
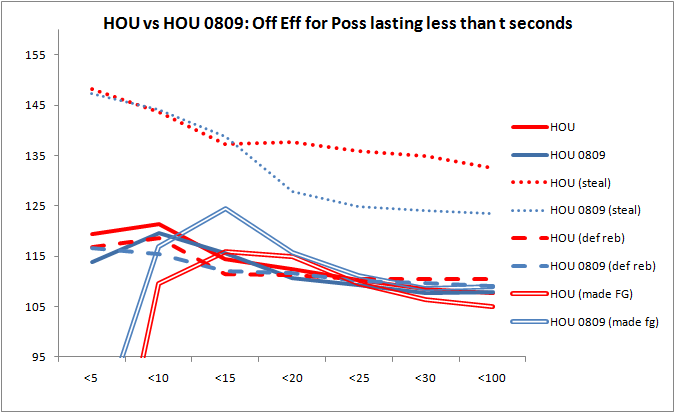
 In the following graphs I carry out the same comparison, but with the Rockets from a season ago (actually, for 72 of the 82 games last year). We see that both overall, and for the various listed possession triggers, the Rockets are getting more short possessions than last year. Again, this graph is actually understating how much more quickly the Rockets are getting into their offense because it is based on possession time instead of time to first shot/foul/turnover.
 For possessions after steals, we see a large improvement for the Rockets this year over last, a consequence of them pushing the tempo more effectively. Overall efficiency is about the same rating over all possessions, though the Rockets are more efficient in possessions under 10 seconds (meaning they are probably less efficient in possessions longer than 10 seconds). Overall efficiency on possessions after made field goals is about 5 points worse for the Rockets this year, unsurprising because its hard for them to run on those possessions.
 There are a couple of directions we could go from here on this investigation of Rockets up-tempo play:
- A good next step would be to plot these graphs using time to first shot/foul/turnover rather than possession time. The Rockets are trying to run more than these graphs probably give them credit, but their offensive rebounding extends a lot of their possessions.
- How do different 5-man lineups impact the shape of these curves?
- It’s evident here that there is offensive value in certain triggers created by the defense. For corresponding reasons, there is also defensive value in running an effective offense. Carrying out a league-wide study of which teams get the most offensive value from their defense, and vice-versa, could be interesting.
Update
I took a look and it turns out that discarding the extra possession time due to offensive rebounds does not show the Rockets to be appreciably faster than the league as I initially had guessed. On average, a Rockets possession lasts 15.7 seconds compared to 15.6 seconds for the league (virtually the same). Only considering the time to first shot/shooting foul/turnover each possession, for the Rockets and the league I found it to be 14.1 seconds. Below, I’ve summarized both the average time to first shot/shooting foul/turnover (or poss_first_time) and offensive efficiency (or ORTG) for possessions following various triggers, both for the Rockets and for the league as a whole. Some comments:
- The “other” trigger refers to possessions that did not start from a steal, defensive rebound, or opponent’s made field goal. Other than the occasional jump ball, these constitute possessions taken from out of bounds where the clock had stopped. The Rockets look to be slightly slower and with less efficiency compared to league average on these possessions.
- As noted above, the Rockets excel efficiency-wise when capitalizing off of steals.
- The Rockets play notably faster than league average after made field goals, indicating an effort to quickly strike back when scored on.
- Off of defensive rebounds, relative to the league they appear to be slow in the ensuing possession. This isn’t a surprise; since the Rockets are small there is more of an emphasis on “gang rebounding” on the defensive end, limiting opportunities for perimeter players to leak out in hopes of a miss and long outlet pass.


