
In the 2012 All-Star Game, Lebron James had the ball in his hands with the game on the line. Guarding him was Kobe Bryant, long lauded for his crunch time successes. Bryant told James to “Shoot the ******* ball.” James did not. He passed. Twice. James’s team lost.
The usual talking heads adopted their usual sides. In one corner, heroball pundits thought that James, as the anointed one, should have taken the shot. In the other corner, basketball purists thought that James made the correct basketball play, passing out of a double team to create a better shot for his teammate. It is a debate that always surfaces. How selfish should NBA players be, especially the good ones? Is it more important to move the ball or for the best players to take the most shots? Until recently, clichés overwhelmed data. But the NBA, like all other professional sports, is quickly becoming more data driven, and we now have data to inform the debate. Who is selfish? Who is selfish and should be? Who is selfish and should not be? This is my contribution to the conversation. Data I am using three specific pieces of information from NBA.com’s new player tracking data:- Passes per game
- Touches per game
- Effective field goal %
The first two measures are self-explanatory. Effective field goal % takes into consideration that three-point field goals are more valuable than two-point field goals. Therefore, a player who hits 5/10 three-point FGs has a higher eFG% than a player who hits 5/10 two-point FGs.
All data were collected December 3, 2013. Sample I limited my analysis to players who average at least 22 minutes per game. I wanted to concentrate on starters, sixth men, and key role players. There were 192 such players as of December 3, 2013. Analysis I created a selfishness measure according to the following formula:- Touches per pass (TPP) – Touches per game / passes per game
TPP measures how many times a player touches the ball before passing. The higher the figure, the more a player does something else with the ball besides pass (assumedly shoots), and presumably the more selfish he is.
I also created a selfishness efficiency measure according to the following formula:- Selfishness efficiency (SE) = TPP * standard deviation of eFG%
SE is a function of a player’s predilection to shoot and his efficiency when shooting. In other words, if a player likes to shoot the ball, what is the likelihood of his shots going in? A high figure indicates great efficiency relative to how frequently the player shoots. A low figure indicates poor efficiency relative to how frequently the player shoots. Players are “rewarded” for being selfish and making shots, but “punished” for being selfish and not making shots.
Standard deviation refers to how far above or below the mean eFG% a player’s eFG% is. I used it instead of just the eFG% to produce positive (above the mean) and negative (below the mean) SE values and because it makes for a prettier graph. Limitations Before presenting the results, there are several limitations that need to be considered. TPP is an imperfect measures of selfishness. For one, it makes point guards look less selfish because they have a “free pass” every possession (the first one after bringing the ball up the court), provided they do not go coast-to-coast. The measure also does not consider that a player who is not passing is not necessarily shooting. A player could be fouled, for example, or turn the ball over. SE has purposefully exaggerated extremes and a compressed middle of its distribution. Players who have very high/low TPPs or eFG%s will find themselves on the same end of the SE distribution, even if their other measure if comparatively less extreme. Thus, a player who has an average TPP (i.e., passes the ball regularly) but a very low eFG% will still be considered selfish and inefficient as measured by SE. Also, any player with average eFG% will have an eFG% standard deviation close to zero, and therefore also have an SE close to zero. Such a player will have an average SE, regardless of how selfish or unselfish he is. Results To show what players have what tendencies, I developed the following infograph (click for full-sized interactive version).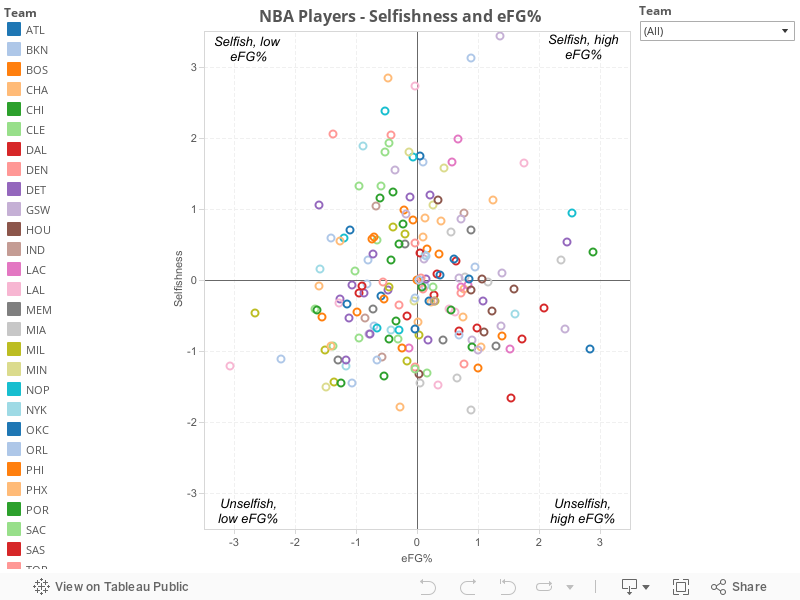 On the x-axis is eFG% and on the y-axis is TPP, labeled “Selfishness.” The top right quadrant (I) contains players who are selfish and have high eFG%. The top left quadrant (II) contains players who are selfish and have low eFG%. The bottom left quadrant contains players who are unselfish and have low eFG% (III). The bottom right quadrant contains players who are unselfish and have high eFG% (IV).
The axes’ units are in standard deviations in order to equalize physical spacing. This also means players’ tendencies are graphed in relation to each other.
In the next parts, I’ll present ranked results of TPP and SE (because lists are great) and discuss what the results could mean for the Houston Rockets.
On the x-axis is eFG% and on the y-axis is TPP, labeled “Selfishness.” The top right quadrant (I) contains players who are selfish and have high eFG%. The top left quadrant (II) contains players who are selfish and have low eFG%. The bottom left quadrant contains players who are unselfish and have low eFG% (III). The bottom right quadrant contains players who are unselfish and have high eFG% (IV).
The axes’ units are in standard deviations in order to equalize physical spacing. This also means players’ tendencies are graphed in relation to each other.
In the next parts, I’ll present ranked results of TPP and SE (because lists are great) and discuss what the results could mean for the Houston Rockets.
