Last month, I took a lengthy look at selfishness in the NBA. I wanted to identify which players were the most selfish, and whether that selfishness correlated with success. Since we’re at the half way point of the season, I decided to revisit the same concept with updated data, and also analyze the data from a team level in addition to the individual level.
Technical information
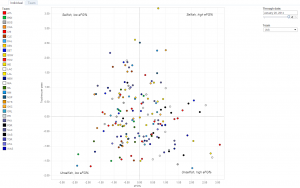
This is largely explained in the initial post, so I’ll be quick. The measure of selfishness I’m using is touches per pass (TPP). A high number indicates more selfishness (touches the ball more before passing it), and a low number indicates less selfishness (touches the ball less before passing it). Players’ TPP are plotted against their effective field goal percentage, because if you’re not going to pass it, then you better make your shots. All units are in standard deviations. Players were only included if they played at least 25 games and averaged at least 22 minutes per game.
A slider in the upper right allows you to toggle between the two times when I’ve collected data. You can also filter by team to examine each team individually. Mouse over for more data about individual players.
At the top left is a tab you can click to view the same graph but from a team level instead of an individual level. The size of each team’s dot indicates that team’s winning percentage.
Limitations
Data for players is not weighted by games or minutes played. Players who have switched teams are shown on their current teams. Data is also calculated from the beginning of the season through specified dates, not in separate segments. In other words, the data for January 20th is not from December 3rd to January 20th, but from the beginning of the season to January 20th.
Data for teams is complete, incorporating all data from every player who has logged a minute. However, players that have switched teams via trades are not included in the team analysis.
Observations
Looking at the individual chart, the Houston Rockets have not changed their offensive strategy very much since December 3rd. The most noticeable difference is that Dwight Howard has becomes a little more selfish and a little more effective from the floor. That’s certainly a good sign. Everyone else has actually regressed slightly in their eFG%. Time will tell whether players are either going through a slump, or are simply playing at their real levels now.
The Rockets are still somewhat close to achieving their theoretical line of awesome. Given Howard’s emergence, James Harden should probably make it a point to be less selfish. As it stands, he was the only player besides Howard to increase in selfishness. Unlike Howard, however, his eFG% did not increase. A team like Charlotte is actually very close to achieving their theoretical line of awesome. Unfortunately for them, their line of awesome appears to be pretty far left on the eFG%. They just don’t have the offensive talent to score a bunch of points, even though they’re playing efficiently relative to everyone’s capacity.
On the team chart, the Rockets as a whole are slightly more selfish than average, but are also shooting the third highest eFG% in the league, undoubtedly due to their three-point volume.
Winning percentage does not seem to correlate with selfishness. This probably isn’t a huge surprise since the chart does not consider defense at all. More interesting is that selfishness also does not appear to correlate with eFG%. While there are excellent offensive teams who are very unselfish (Heat, Spurs), the least selfish teams are pretty putrid offensively (Bobcats, Utah). That probably indicates that there’s a difference between passing to get a good shot and passing because no one can shoot.
View this discussion from the forum.


