Jump to content


Toggle shoutbox Shoutbox Open the Shoutbox in a popup

@  feelingsuper... : (01 March 2014 - 12:37 AM) Agreed, if any 3 of those coaches could immediately plug them in and get anything g it would have been Pop. Guess I am relieved now that you remind me of that.
@  Alituro : (28 February 2014 - 09:19 PM) You're right though, LAC and OKC are both dangerous enough to worry about, but they could contribute right away on the Spurs, who I was banking on remaining hobbled.
@  Alituro : (28 February 2014 - 09:17 PM) I would just rest easier knowing they're at the bottom of our conference or in the other. Both can be dangerous, esp in the right environment
@  feelingsuper... : (28 February 2014 - 08:57 PM) I think the verdict is still out, my guess is Butler contributes sporadically and I believe Granger is damaged goods, guess we'll see Alituro
@  Alituro : (28 February 2014 - 08:25 PM) FSS-- Oh NO! absolute worst possible case scenario for us, except SA scooping one up..
@  feelingsuper... : (28 February 2014 - 06:34 PM) Butler to Thunder and Granger to Clippers...
@  miketheodio : (27 February 2014 - 06:45 AM) lots of shots missed at the rim =/
@  feelingsuper... : (27 February 2014 - 06:17 AM) I think the Rockets looked good but just ran out of gas and then struggled to stay focused. Parsons needs to figure out when he needs to stop shooting some nights.
@  MrLobble : (27 February 2014 - 06:13 AM) I actually hope we go on a super winning streak or lose a couple... i don't want to see LAC in the 1st rd
@  MrLobble : (27 February 2014 - 06:13 AM) or no Power Forward
@  Cooper : (27 February 2014 - 06:12 AM) not going to beat playoff teams with Parsons no showing and cold harden/lin.
@  MrLobble : (27 February 2014 - 06:09 AM) when can we promote Canaan into lins spot?
@  YaoMan : (27 February 2014 - 04:40 AM) I like this kid Hamilton!
@  YaoMan : (27 February 2014 - 04:39 AM) Too many turnovers again - unforced turnovers. What is Bev trying to dribble around Paul for? And that Howard pass to no one...
@  YaoMan : (27 February 2014 - 04:15 AM) I thought we were going to see another game like the one in early November...
@  Cooper : (27 February 2014 - 04:13 AM) can't beleive Turkoglu still plays professional basketball.
@  SadLakerFan : (26 February 2014 - 05:51 AM) That's true; it was a bit of a weird tangent - but I think I was just following up the previous comment. Perfect game from the Rockets. Looking forward to tomorrow.
@  miketheodio : (26 February 2014 - 05:37 AM) hamilton had a nice looking shot. canaan still looks a little hesitant/nervous.
@  feelingsuper... : (26 February 2014 - 05:35 AM) You lost me SadLaker, of all the things to talk about and that is the tangent you go on, okaaaayyyyy.
@  SadLakerFan : (26 February 2014 - 05:26 AM) If the lead drops to 10-15 points, that is.

Photo

The Big Book on Offensive and Defensive Ratings


21 replies to this topic

#1 Red94

Red94

    Advanced Member

  • Administrators
  • 940 posts

    Posted 25 February 2014 - 01:20 AM

    New post: The Big Book on Offensive and Defensive Ratings
    By: Richard Li

    [caption id="attachment_14092" align="aligncenter" width="300"]Thumbnail 
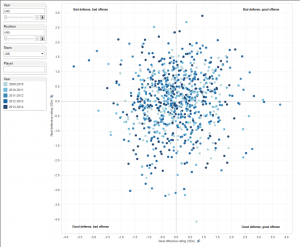
Click for a full-sized, interactive version[/caption]

    It's not a mystery that I've been crusading to find a better measure for individual performance. But no matter what I seem to do, I run up against annoying obstacles. Chief among these annoyances is that individual performance is inextricably tied up in team performance. For example, I could suck on defense but if my center blocks the shot of the guy that zips by me then my defensive statistics look pretty good. Also annoying is that individual performance is biased towards certain positions. Any reliable measures have to at least take these two factors into consideration.

    Up until now, I've been lazily trying to account for these biases by subtracting out averages one at a time. But I finally decided to roll up my sleeves and really get to work on it. Roughly four days of number crunching later, I've produced results that I'm quite proud of and, more importantly, confident in. Using five years of data encompassing over 2,500 players (sucks to your sample size), I was able to statistically control for the effect of team performance, position bias, and opponent performance on individual player ratings, leaving (hopefully) just the players' individual performances. The link above provides a chart and two tables that shows all of the findings.

    Let's talk about the weather

    To actually do what I just said, I had to use a method that you've probably heard of in hushed whispers. It's called a linear regression. I'll spare you the grad school pain and just provide a simple example that shows what a linear regression does, and how it can be used.

    Let's say I want to statistically predict the temperature of any place on Earth. You and I crack open a few beers and start identifying factors that probably affect temperature (because cracking open beers is what we do after deciding to do statistical work). We decide that the biggest factors that would influence the temperature of a place are latitude, time of year, and time of day. Then we go to a magical database that only exists in fairy tales and retrieve a bunch of data about the temperature of all places,  at all latitudes, at all times of year, and all times of day. We then feed all of this information into a computer. With enough information, the computer can begin predicting temperatures around the world. So if we want to know what the temperature in Helsinki is right now, we tell the computer the latitude of Helsinki, the time of year, and the time of day. The computer then spits out a predicted temperature based upon all the information we've fed it from before.

    But all of a sudden your crazy aunt calls us, and she happens to be the president of Finland. She says that she ordered every city in Finland to become warmer by making everyone to rub their hands together 24/7, and wants to know which cities have succeeded the most. She knows she can't just take a look at the raw temperatures because some cities are supposed to be colder than others, because they're farther north or something. So what to do? First, we crack open more beers. Then we tell the computer to perform one extra step. We get the actual current temperature of all cities in Finland and give it to the computer. The computer does the same thing it did before--predict the temperatures for the cities based upon the information we gave it from before. But now it subtracts the actual temperatures of the cities from the predicted temperatures. We can then identify which cities have temperatures wildly different from what we would expect given historical data.

    NOTE: This isn't the technical definition of a linear regression and actually encompasses a spin off concept called a residual. But you don't care about that. You just care that this is an example of what I did to produce this post.

    Basketball

    OK, enough with the weather. What I did was grab data from all NBA players from the last five years. The specific factors I was interested in was players' teams, players' positions, players' individual offensive and defensive ratings, players' teams offensive and defensive ratings, and players' opponents offensive and defensive ratings (basketball reference thankfully did this last step for me, combining team and opponent ratings into one stat). I then fed all of this information into my computer, weighted according to the number of minutes each player played, and asked it to predict what each player's individual ratings should be given how good their teams' ratings were, how good their opponents' ratings were, and their positions.

    The for all players who played at least 50 games (35 games for this season) and at least 22 mpg, I subtracted their actual individual ratings from their predicted ratings, leaving us with what I call the players' real ratings. A real rating is basically what's left of a player's offensive or defensive rating after we take out the effects of his position, team, and opponents. Finally, I standardized those ratings into standard deviations.

    Some notes

    When interpreting the chart and tables, don't think of it as player X is better than player Y. Think of it as player X is doing better than would be predicted relative to player Y.

    I'm also not going to talk about limitations because the last thing I want to do after all this work is identify everything that could be wrong with it.

    Observations

    Still with me? You better be, because I spent a lot of time on this. There's an enormous amount that can be pointed out, and I'll let everyone else do most of it. Here are just a couple of teasers.

    • Talk of Dwight Howard's decline are true. From 2009-2012, his real defensive rating was over three standard deviations. If this were a standardized test, that would be 99th percentile, and he did it for three straight years. He was first in the league in two of those years, and second in the other one. Last year though, his real rating dipped to 1.8 SDs, and this year it's 1.3 SDs.
    • Sustained success should be rewarded. Check out someone like Chris Paul. Both his offense and defense are consistently amazing. Also Josh Smith's defense, which doesn't receive too much publicity.
    • Trends are also worth noting. We know that Howard is trending downward, but look at Steph Curry's offense... and his defense. Anthony Davis is setting up to be some kind of monster. Tony Parker's defense might be the least-but-should-be-most criticized element of anyone's game. Boogie Cousins's defense should maybe receive more attention.
    • Tyson Chandler's offensive ratings are insane, not just because they're high but because they're consistent and he's not exactly an offensive juggernaut himself. I guess that goes to show you don't need to be a prolific scorer to help your team put points on the board.
    • In true moneyball/analytics fashion, a few diamonds in the rough are popping up. Most notable is Martell Webster, who is actually the highest rating offensive player this year and second highest last year. Remember, this doesn't mean he's the best offensive player. It means he's doing the best given his circumstances relative to everyone else and their circumstances. This could be the result of dumb luck (unlikely since he did it last year too), talent, or that he might fit his role perfectly. I don't know enough about the Wizards to speculate past that.

    Something geeky and statistical worth mentioning

    When doing linear regressions, there's a statistic called the R-squared. Technically stated, R-squared represents the amount of variance in a dependent variable (individual ratings in our case) that is explained by the independent variables in the model (position, team performance in our case). In more layman's terms, it means how complete a model is, or how much of something can be accounted for by other somethings.

    I mention this because, for defense, position, team performance, and opponent performance accounted for a whopping 80% of individual performance. For offense, it was only 18%. That 80% of humongous. It means a couple of things. First, that factors outside of an individual player's control are largely responsible for deciding an individual's defensive rating. Second, if there's something else going on that the model has not considered (which there always is), that something is not very important.

    The opposite is true for offense. Position, team performance, and opponent performance are not responsible for very much of a player's individual offensive rating. Either his own performance is very responsible for his own rating, or there's something else going on that the model has not considered (which there always is) that's really impacting players' offensive ratings. The smaller R-squared for offense might also help explain why the offensive ratings are a little more unexpected than the defensive ratings--the model is just less complete.

    A final comment

    This is more of a pet peeve of mine. The whole point of data is to help make conclusions. It is not to confirm an already existing conclusions. If you think that player X is the best player ever, and a piece of data analysis does not rank player X as the best player ever, the wrong reaction to have is to claim that the data analysis is wrong. That's not how this exercise works. You can and should find faults in the data that was used, or the methods, but a pre-formed opinion should never be used to criticize the results.


    • 0

    #2 kidnextdoor

    kidnextdoor

      Newbie

    • Members
    • Pip
    • 3 posts
    • LocationHouston

    Posted 25 February 2014 - 01:51 AM


    The chart is labeled wrong, the quadrant that is "Bad defense, good offense" should be good defense, good offense


    • 0

    #3 Jatman20

    Jatman20

      Rookie

    • Members
    • PipPip
    • 59 posts

      Posted 25 February 2014 - 02:03 AM

      I'm glad it's something that you enjoy doing Mr. Li, and you are not knocking your brain out while disliking it. There are so many variables to consider and I'm glad you are comfortable with your conclusions. I had problems with some previous analysis on the basis of Eastern Conference players playing vs a majority of weaker Eastern Conference teams (players) therefore should not be compared with Western Conference players.... distorting stats.....or like when Nov and some of Dec schedules were completed and I heard Houston had one of the hardest schedules to that point while San Antonio and Portland had one of the weakest schedules. Now I'm wondering how bad is Hamilton's defense without McGee backing him up and now has a D12 and Asik backing him up. Mozgov is famous for being posterized. I saw an early game featuring D12 last season with the Lakers in which PG Blake let a guy burn by him; D12 left his man only a have a quick pass go to his man for an easy dunk. D12 turned to Kobe and chewed him out (national TV) for not rotating to his man!! D12 was right in that situation. I didn't see D12 leave his man so much the rest of the season. The stats may be distorted for last year as a result. Kobe free-lances too much and Nash/Blake couldn't guard anybody.

      Stats are a good basis, but don't show everything. Report I read recently stated analytics are causing a lot of anger among fans for what they say is an over-thinking that ruins the sport. I love analytics, but I use the K.I.S.S. rule. Keep It Simple S.

      As in most things in life......I just take it with a grain of salt.
      • 0

      #4 shirtless

      shirtless

        Newbie

      • Members
      • Pip
      • 34 posts

        Posted 25 February 2014 - 03:06 AM


        For defensive rating, lower numbers are better, so the quadrants are labeled correctly.


        • 0

        #5 Chichos

        Chichos

          Junior Member

        • Members
        • PipPipPip
        • 193 posts

          Posted 25 February 2014 - 04:37 PM


          This is just me grasping at straws in my defense of Howard, but pace seems to really have a huge impact on defense as well as system. Howard's Orlando teams never ranked higher thank 18th in pace while he was dominant on the defensive end. Van Gundy was also one of those guys who had everyone sprint back on defense and ignore the offensive rebound, even if they set up in the corner on offense.

          Once Howard was taken out of a system that provided extra help and stuck on an island he started looking a lot more human. Obviously the back issues did not help anything. Is there any way to exclude offensive plays that ended withing 3 or 4 seconds? One would assume true fast breaks don't last longer then that and the defense would have at chance to set. Last year Morey tweeted about the Rockets being a top ten unit in such situations.

          Obviously a system change does not account for dropping from somewhere in the 99th percentile to the 60 somethingth(if it wasn't a word it is now). But extreme styles of offense and defense tend to create very different opportunities.

          Pace
          http://espn.go.com/n...actor/year/2010
          OR rate
          http://espn.go.com/n...dRate/year/2010


          • 0

          #6 NorEastern

          NorEastern

            Junior Member

          • Members
          • PipPipPip
          • 213 posts

            Posted 25 February 2014 - 04:45 PM


            I applaud your effort! I know how tedious it is to collect all of that information; the hours and days needed to crosscheck the data and not to mention the ever present formatting inconsistencies that creep in. I actually have been driven to drink by such things as one data source using "Patty Mills" and another using "Patrick Mills".

            I do have a few questions. How do your results compare to xRAPM, WP etc.? I personally am a big fan of xRAPM because you can add up the oRAPM and dRAPM scores and get a pretty good idea how a team is going to next season, or for that matter the rest of this season, on the offensive and defensive ends of the floor. Is this the case with your metrics?

            To use the Dwight Howard example, is there any way to correct for the differences in his ratings caused by moving from an Orlando team that was constructed around him, to the Lakers and Rockets, which have not had time to integrate him properly into their systems? That Orlando team had years to surround Howard with matching pieces, and to bring his teammates up to an appropriate skill level in such areas as passes into the post. I actually know the answer to this question, but I had to ask. Sorry.

            I have other questions, but those seemed to be the big ones. Please do not take this comment to be in any way critical of your work.


            • 0

            #7 Chichos

            Chichos

              Junior Member

            • Members
            • PipPipPip
            • 193 posts

              Posted 25 February 2014 - 05:12 PM


              Another fun fact is the Jeremy Lin is the only current Rocket to fall in the dreaded bad at offense and defense quadrant... That salary is starting to look like it could be better used on paying Parsons and replacement player X. Lets hope expiring deals have a little more value next year.


              • 0

              #8 shirtless

              shirtless

                Newbie

              • Members
              • Pip
              • 34 posts

                Posted 25 February 2014 - 06:58 PM


                Offensive and defensive ratings are pace adjusted because they're points per 100 possessions.

                I'm not familiar with those stats. I'll take a look at them and get back to you.


                • 0

                #9 Steven

                Steven

                  Senior Member

                • Members
                • PipPipPipPipPip
                • 1,430 posts

                  Posted 25 February 2014 - 09:19 PM

                  Another fun fact is the Jeremy Lin is the only current Rocket to fall in the dreaded bad at offense and defense quadrant... That salary is starting to look like it could be better used on paying Parsons and replacement player X. Lets hope expiring deals have a little more value next year.

                  They won't, cause Lin is owed $15M next season. No team is ponying that up for an average PG. That's the same reason no one wanted to take on Asik. The contracts got them to Houston, but also guarantee they will stay there until the end of next season, unless Alexander sends out $3M along with the player at the trade deadline next February.
                  • 0

                  #10 GradStat

                  GradStat

                    Newbie

                  • Members
                  • Pip
                  • 2 posts

                    Posted 26 February 2014 - 01:12 AM


                    I think your analysis, more than anything, encourages individual player. Those who "out-perform" his teammates are rated as good offensive/defensive players. If the presence of a player makes his team perform better, the better his team play, the worse he will be rated in your analysis. Or, if the presence of a player makes his team perform worse, the worse his team play, the better rating he gets. That does not sounds good to me.


                    • 0

                    #11 GradStat

                    GradStat

                      Newbie

                    • Members
                    • Pip
                    • 2 posts

                      Posted 26 February 2014 - 01:25 AM


                      In your analysis, Tyson Chandler(2011-2012), defensive player of the year, is rated average defensively. Kyle Korver(2013-2014) is about twice as good, offensively, as James Harden. What???


                      • 0

                      #12 shirtless

                      shirtless

                        Newbie

                      • Members
                      • Pip
                      • 34 posts

                        Posted 26 February 2014 - 02:30 AM

                        I think your analysis, more than anything, encourages individual player. Those who "out-perform" his teammates are rated as good offensive/defensive players. If the presence of a player makes his team perform better, the better his team play, the worse he will be rated in your analysis. Or, if the presence of a player makes his team perform worse, the worse his team play, the better rating he gets. That does not sounds good to me.


                        If I'm understanding you correctly, I think I agree with the first half of what you said. Each player's individual rating is a product of three factors--performance relative to team, relative to position, and relative to opponent. If your rating is better than your team's, better than your position's, and better than your opponent's opposite stat (offense or defense), then you will rank highly. The opposite if you perform less well. So the first half of your statement is correct IF said player plays an enormous amount of minutes. Kevin Durant probably falls into this category. He plays about 40 minutes a game, so his team's rating and his own rating are pretty close (very high) simply because the Thunder don't spend very much time without him. That being said, he's still second highest in the league, so it's not like he's not registering any blip.


                        I'm not surprised at all that someone like Kyle Korver ranks highly. He's a super efficient offensive player who does his job extremely well. He, and other players like him (Wes Matthews, for example) are heads and shoulders above the guy behind them on the depth chart. Their game (28 foot 3 point shots) are also less affected by stout defensive teams, so they get that boost. 


                        I'm also not surprised that some players don't align well with awards that they receive. I've said in a couple of posts now that centers are the most impactful defensive players, but that does not mean they are necessarily the best individual defensive players. The ratings bias them heavily because of their role, and this post removes that bias. Still, an average rating does not mean a player is bad. It means that relative to his team's performance, his position's performance, and his opponents' performance, he was average. If you're average on a great team, that's pretty good. 


                        Remember, players aren't going to fall neatly along their reputations. That's the whole point of doing something like this, to see if something can be identified that was previously hidden. 


                        Edited by shirtless, 26 February 2014 - 02:32 AM.

                        • 0

                        #13 shirtless

                        shirtless

                          Newbie

                        • Members
                        • Pip
                        • 34 posts

                          Posted 26 February 2014 - 02:41 AM

                          On a related note, the real value of something like this is to measure the performance of people like Kendrick Perkins and Nikola Pekovic. If you just look at their defensive ratings, they're 102 and 106 points per possession, respectively. That actually doesn't look bad. In fact, 102 is better than Chris Paul, and 106 is better than Patrick Beverley.


                          However, those ratings can't be interpreted at face value because of all the reasons I've been talking about. They're centers, so their ratings become deflated just cause they're big and stand close to the basket. They're more important on defense, but that doesn't mean they're better on defense than people like Paul or Beverley. So if you control for the fact that they are centers, and that they might play with some pretty good defensive teammates (look at Durant's rating, Thabo's rating, or Rubio's rating), the picture changes completely and they become two of the worst defenders in the league, all those factors considered. 


                          Edited by shirtless, 26 February 2014 - 02:41 AM.

                          • 0

                          #14 GiGo

                          GiGo

                            Newbie

                          • Members
                          • Pip
                          • 1 posts

                            Posted 26 February 2014 - 01:36 PM

                            Unless I'm mis-understanding, this analysis takes account of the player's position. 

                            For the Rockets, Beverly is currently labeled as an SG in the workbook.

                            Unless the same result is produced if Beverly is labeled as a PG, this could be an example -

                            an example of how any analytical statistic is only as accurate as the veracity (or perceived veracity) of the data captured.

                            This comment is not intended to criticize the work that went into this article.

                            It's self-evident that a lot of time, effort and knowledge was required to produce any analysis such as this.


                            • 0

                            #15 thejohnnygold

                            thejohnnygold

                              Veteran

                            • Moderators
                            • 2,648 posts
                            • LocationAustin, TX

                            Posted 26 February 2014 - 03:01 PM

                            I keep finding myself thinking about the BCS formula.  I think I understand better now than ever before why the human element is so crucial (despite its flaws).  These ratings make perfect sense in a lot of ways, but only if one has the proper context.


                            For instance, if somebody who knew nothing of basketball looked at the 2012-13 PF's they would see that Chris Anderson and Lebron James are both in the good defense/good offense category.  They would also see that Anderson exceeds James by about .5 standard deviations in both offense and defense.  What they wouldn't see is why.  Now, we all know why.  These numbers support what a superior complimentary player he is.


                            There are lots of these floating around and without knowing the game very well they could be misleading.  Somehow Josh McRoberts finds himself in the bad defense/good offense quadrant opposite of Al Jefferson who slides into good defense/bad offense.


                            I'm not nit-picking.  I think everything is fine given the enormity of the undertaking.  I am curious about incorporating that human element.  There is a thing called the ELO Rating that basketball-reference.com has.  It is just for fun and is as flawed as the day is long, but it does provide some much needed context--the one thing computers and mathematical systems simply cannot provide.


                            Here is the LINK


                            Anyone can participate in it.  Simply go HERE and vote to become part of the ELO rating system.


                            Rocket fans will be pleased to see Olajuwon ranks #2 all time according to this ranking...1 spot ahead of Michael Jordan.  Larry Bird is first.  Oscar Robinson, John Stockton, and Karl Malone round out the top 6.  So, clearly there is bias at work here--it is a player popularity rater as much as anything.  But that's the point.  Adding that element is the kind of thing that would correct for the Lebron James/Chris Anderson situation.


                            I realize that's not the purpose of this exercise and I haven't spent enough time with it to find those quirky discoveries one sees when looking at things in a new light.  These are just my initial thoughts.  Thank you, Richard.  Perhaps I need to crack open a beer and then have a go at it...you know, to re-create the proper framework and perspective :)


                            • 0

                            #16 Chichos

                            Chichos

                              Junior Member

                            • Members
                            • PipPipPip
                            • 193 posts

                              Posted 26 February 2014 - 08:42 PM

                              They won't, cause Lin is owed $15M next season. No team is ponying that up for an average PG. That's the same reason no one wanted to take on Asik. The contracts got them to Houston, but also guarantee they will stay there until the end of next season, unless Alexander sends out $3M along with the player at the trade deadline next February.

                              Way too much is made about the costs of paying player X in any year if it does not have cap implications.  That is why the amnesty provision/ stretch provisions are used so freely.  I agree that will be a negotiating tactic teams will attempt to use, but the cash flow the league is enjoying right now is insane.  I think the tax penalty of the nets alone is over 100 million at this point.  If you are under the tax you could take Jeremy Lin and have the Nets pay his off the books salary by themselves (editors note: that was for dramatic effect as I have no idea how many teams are under the tax).


                              Back to the stats topic though


                              On a related note, the real value of something like this is to measure the performance of people like Kendrick Perkins and Nikola Pekovic. If you just look at their defensive ratings, they're 102 and 106 points per possession, respectively. That actually doesn't look bad. In fact, 102 is better than Chris Paul, and 106 is better than Patrick Beverley.


                              However, those ratings can't be interpreted at face value because of all the reasons I've been talking about. They're centers, so their ratings become deflated just cause they're big and stand close to the basket. They're more important on defense, but that doesn't mean they're better on defense than people like Paul or Beverley. So if you control for the fact that they are centers, and that they might play with some pretty good defensive teammates (look at Durant's rating, Thabo's rating, or Rubio's rating), the picture changes completely and they become two of the worst defenders in the league, all those factors considered. 

                              I think you are saying this is a great tool for team building.  If you inderstand the role you are looking to fill you could compare similar players in similar roles to find out who might fit best.  Lets say you are looking for a 6th man gunner.  You could create a pool of all the players utilised in such a manner and decide very broadly if player A is doing a better job in that role then player B. 


                              We just want to stay away from half baked conclusions like holy &%*$ Tyson Chandler is the most dominant offensive player in basketball 4 years running.  Although if you are looking for someone who impacts the offense very positively when used as a screen and dive center, Chandler looks like your guy.


                              • 0

                              #17 shirtless

                              shirtless

                                Newbie

                              • Members
                              • Pip
                              • 34 posts

                                Posted 26 February 2014 - 11:06 PM


                                I think you are saying this is a great tool for team building.  If you inderstand the role you are looking to fill you could compare similar players in similar roles to find out who might fit best.  Lets say you are looking for a 6th man gunner.  You could create a pool of all the players utilised in such a manner and decide very broadly if player A is doing a better job in that role then player B. 


                                We just want to stay away from half baked conclusions like holy &%*$ Tyson Chandler is the most dominant offensive player in basketball 4 years running.  Although if you are looking for someone who impacts the offense very positively when used as a screen and dive center, Chandler looks like your guy.


                                I got so interested by the Tyson Chandler part that I looked into it a bit more. According to basketball reference, Tyson Chandler led the league for three seasons in offensive rating, with over a whopping 130 points per possession in each of those years. You can criticize offensive rating as a way of capturing offensive performance, but you can't criticize Chandler's performance in that stat. It's just amazing, and he's done it consistently. Even with this year's putrid Knicks team his offensive rating is 120. 


                                Like I said, this type of exercise is a good way of identifying something that might have previously been hidden from the naked eye. Chandler only averages a dozen points per game, and isn't going to take a shot outside of 8 feet, but he's very disciplined in playing within himself and doing other things to help his team score. His FG% those years were laughably high (like ~65%), and he had something of a free throwing shooting renaissance (~70%), resulting in insane true shooting percentages. Plus he crashes the offensive boards and does all the unmeasurable stuff like set screens. 


                                This doesn't mean you're going to run an offense through Tyson Chandler, but it does mean that he should probably deserve more credit than he gets for his contributions on offense. 


                                Edited by shirtless, 26 February 2014 - 11:07 PM.

                                • 0

                                #18 Knickabokkaz

                                Knickabokkaz

                                  Junior Member

                                • Members
                                • PipPipPip
                                • 182 posts

                                  Posted 27 February 2014 - 12:46 AM

                                  Another fun fact is the Jeremy Lin is the only current Rocket to fall in the dreaded bad at offense and defense quadrant... That salary is starting to look like it could be better used on paying Parsons and replacement player X. Lets hope expiring deals have a little more value next year.


                                  Lin fans been wanting Lin out since the beginning if the season. Your late on the "hope" for wanting Lin out of Houston, and I could GUARENTEE you we both have different reasons for wanting him out of Houston.

                                  Edited by Knickabokkaz, 27 February 2014 - 12:47 AM.

                                  • 0

                                  #19 thejohnnygold

                                  thejohnnygold

                                    Veteran

                                  • Moderators
                                  • 2,648 posts
                                  • LocationAustin, TX

                                  Posted 27 February 2014 - 02:23 AM

                                  Lin fans been wanting Lin out since the beginning if the season. Your late on the "hope" for wanting Lin out of Houston, and I could GUARENTEE you we both have different reasons for wanting him out of Houston.


                                  1081.gif


                                  C'mon man, we've beaten this horse to death.  Everyone knows how you feel.  We're all impressed by your vigilance, but this has reached a point where the posts aren't valuable or productive.  If (read, "when") you feel compelled to remind us in the future could you at least include something new and interesting that is actually basketball related rather than solely fan related?  This is not the place for that kind of inflammatory rhetoric. 


                                  I'm sure you have read the post pinned to the front page regarding divisive posts about Lin.  You can either be part of the problem or part of the solution.  Either way, this needs to stop.  The ice is getting very thin.


                                  • 0

                                  #20 Steven

                                  Steven

                                    Senior Member

                                  • Members
                                  • PipPipPipPipPip
                                  • 1,430 posts

                                    Posted 27 February 2014 - 03:50 AM

                                    Way too much is made about the costs of paying player X in any year if it does not have cap implications. That is why the amnesty provision/ stretch provisions are used so freely. I agree that will be a negotiating tactic teams will attempt to use, but the cash flow the league is enjoying right now is insane. I think the tax penalty of the nets alone is over 100 million at this point. If you are under the tax you could take Jeremy Lin and have the Nets pay his off the books salary by themselves (editors note: that was for dramatic effect as I have no idea how many teams are under the tax).

                                    Except not everyone was given huge oil reserves by Putin cause they are his boy. Putin's boy is going to write a $5M dollar check to all of the non-tax teams this year, but that only covers a third of Lin's contract. Money doesn't matter to the uber rich, and only the Russian is that (and maybe Paul Allen if he owns the Trailblazers.)

                                    BTW, Lin's contract next season = OKC Local TV revenue.

                                    Edited by Steven, 27 February 2014 - 03:52 AM.

                                    • 0


                                    0 user(s) are reading this topic

                                    0 members, 0 guests, 0 anonymous users