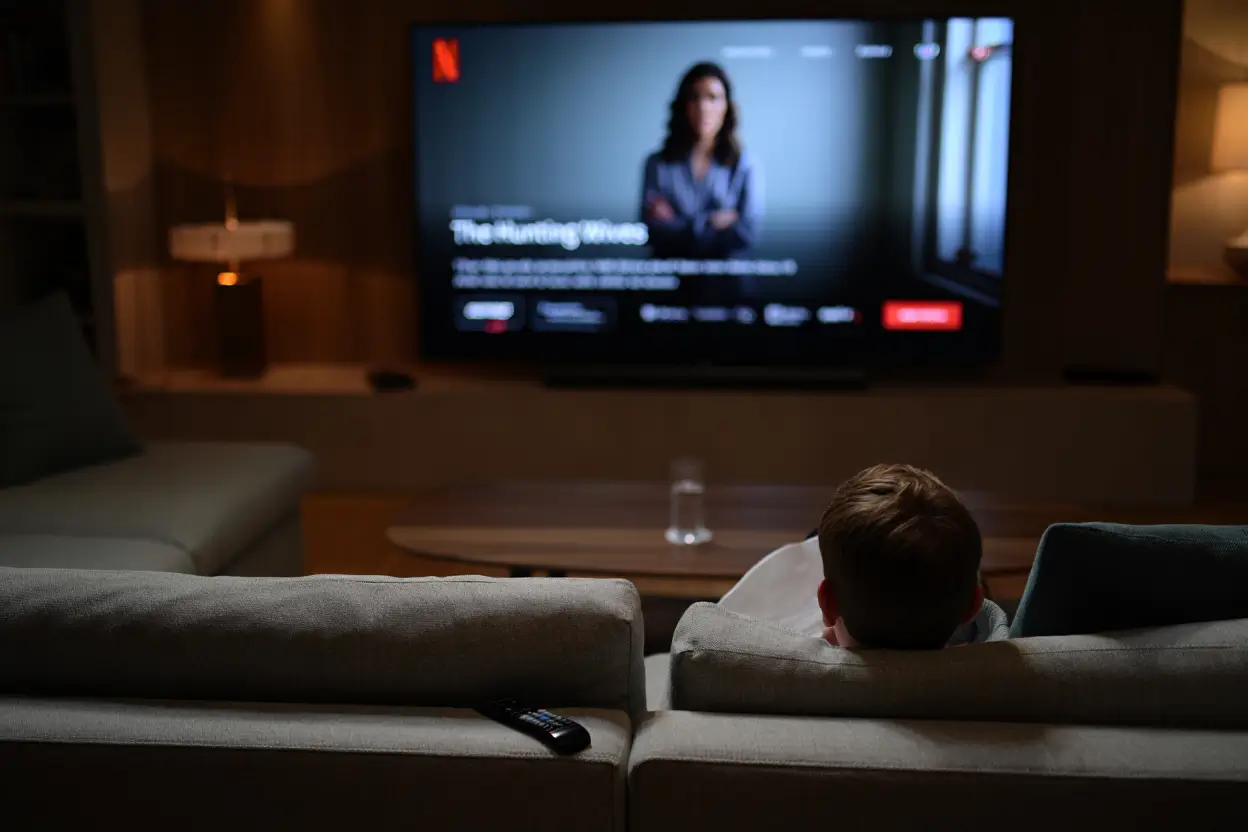
Netflix’s surprise streaming surge came the week of July 28–Aug. 3, 2025, when The Hunting Wives logged 1.58 billion minutes, vaulting to the top original-series slot and second overall. Adam Sandler’s Happy Gilmore 2 still led all titles at 1.99 billion minutes, but The Hunting Wives improved 16% from its premiere week — a rare second-week boost. Nielsen’s TV-set minutes show Netflix dominating the top 10, while other hits like KPop Demon Hunters and Untamed show how fast viewership can spike — then drop — in the streaming era.
What the July 28–Aug 3 Nielsen crown reveals about streaming 2025
- The Hunting Wives reached 1.58B minutes in the week of Jul 28–Aug 3.
- Happy Gilmore 2 topped all titles with 1.99B minutes that same week.
- Nielsen measures TV-set minutes only, excluding mobile and desktop viewing.
- The Hunting Wives rose 16% from its premiere week, defying usual drop patterns.
- Netflix held most top-10 slots, underscoring platform dominance in U.S. living rooms.
Why a 1.58B-minute week is a turning point for Netflix in 2025
TubiTV Just Hit 200 Million Users – Here’s Why
10 Perfect-Score Shows Buried on Prime Video Right Now
Nielsen’s week shows more than a chart position: it signals where viewers went this summer and how Netflix’s slate still grabs mass attention. A 1.58 billion-minute week for a series that moved from Starz to Netflix proves platform migration can yield huge returns. That 16% week-over-week gain is unusual — most debuts fall off — and suggests strong word-of-mouth and binge behavior. For studios and advertisers, the data hint that eventized releases (big marketing + platform push) still change rankings quickly, but keeping audiences beyond week one remains the bigger business challenge.
Who reacted to Netflix’s 1.58B-week — top outlets and social buzz
Industry outlets amplified the Nielsen report instantly, framing the week as both a win for Netflix and a volatile reminder of modern viewing patterns. Social posts highlighted the surprise second-week lift for The Hunting Wives and compared it to Happy Gilmore 2’s record launch; coverage framed Netflix as both a launchpad and a metrics machine that can push older shows back into prominence.
What Nielsen minutes (1,989M, 1,579M) tell us about viewer habits now
The $3.99 Streaming Service With 500+ Oscar Winners Nobody Knows About
Cancel These 3 Subscriptions Before November 1st – Here’s Why
The raw minutes show two behaviors: massive one-off openings and fast audience churn. Happy Gilmore 2 opened at 1.99B minutes and then softened; Untamed fell more than half by week three to 872M minutes. By contrast, The Hunting Wives grew 16%, suggesting serialized dramas can gain momentum through social chatter. Nielsen’s TV-only scope means the totals undercount phone and PC viewing, but they still reveal which titles occupy living-room attention and advertising value during the crucial late-summer window.
Key streaming numbers: minutes, ranks and week-over-week shifts (Jul 28–Aug 3)
| KPI | Value + Unit | Scope/Date | Change/Impact |
|---|---|---|---|
| Happy Gilmore 2 minutes | 1,989M minutes | US, Jul 28–Aug 3, 2025 | Record-opening; later -31% WoW drop |
| The Hunting Wives minutes | 1,579M minutes | US, Jul 28–Aug 3, 2025 | +16% vs premiere week; series surge |
| KPop Demon Hunters minutes | 1,102M minutes | US, Jul 28–Aug 3, 2025 | Up from 1,030M prior week; sustained |
| Untamed minutes | 872M minutes | US, Jul 28–Aug 3, 2025 | Fell >50% in week three; rapid churn |
| Nielsen coverage | TV-set minutes only | US, Jul 28–Aug 3, 2025 | Excludes mobile/desktop; partial view |
Summary: Netflix dominates TV-set minutes, but big openings and fast drop-offs shape volatility.
Sources
- https://www.hollywoodreporter.com/tv/tv-news/streaming-ratings-july-28-aug-3-2025-1236356217/
- https://deadline.com/2025/08/happy-gilmore-nielsen-record-untamed-hunting-wives-kpop-demon-1236494637/
- https://variety.com/2025/tv/news/kpop-demon-hunters-ratings-netflix-1236478933/
Similar posts:
- Netflix’s surprise summer hit reached 1,579M minutes (Jul 28–Aug 3, 2025) — what’s next?
- Streaming shock: 1.58B minutes lift ‘The Hunting Wives’ — what Netflix gained in Aug 2025
- Why 2.893B Minutes in July 2025 Changes Netflix’s Release Playbook
- Netflix’s ‘The Hunting Wives’ Climbs to 1.579B Minutes — Here’s Why 2025 Changes
- Top 7 Hits On Netflix And Beyond In 2025 — Why These Numbers Matter

Jessica Morrison is a seasoned entertainment writer with over a decade of experience covering television, film, and pop culture. After earning a degree in journalism from New York University, she worked as a freelance writer for various entertainment magazines before joining red94.net. Her expertise lies in analyzing television series, from groundbreaking dramas to light-hearted comedies, and she often provides in-depth reviews and industry insights. Outside of writing, Jessica is an avid film buff and enjoys discovering new indie movies at local festivals.

