


By: Richard Li
Last year, I took some extended looks at crunch time performance (here and here). I'm going to continue doing so this year, starting with this article. Moreover, I'm going to examine it from a very macro perspective to better capture and criticize the heroball phenomenon.
In economics, there's a measurement you may have heard of called the Gini Coefficient. It measures how equitably something is distributed in something else (e.g., how equitably is income distributed in a country). Borrowing the Gini Coefficient, I've created a measurement I call the Ballhog Coefficient. It measures how equitably shot attempts are distributed in the NBA. To illustrate this measurement, consider this graph.
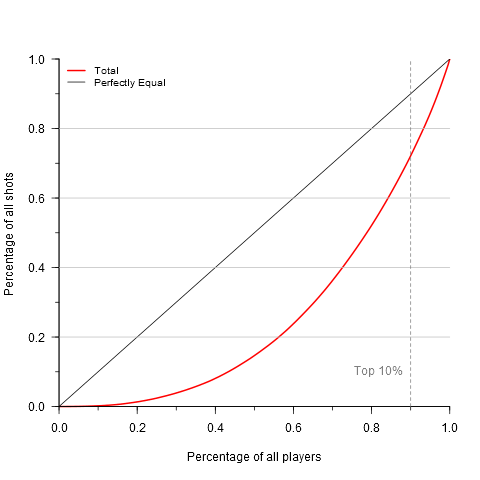
This graph represents the distribution of all shot attempts in the NBA from the 2013-14 season. On the x-axis is the cumulative percentage of all NBA players. On the y-axis is the cumulative percentage of all NBA shots. To read the graph, simply pick a point and find the x-y intersection. For example, on the red curve, which represents all data from last year, the first 20%, aka the bottom 20%, of the population barely registers any shots. Moving right along the x-axis, we eventually reach the dashed grey line, which represents where the top 10% of NBA shot takers begin. To the left of this is 90% of all NBA players, who collectively take around 70% of all shots. That means the top 10% of NBA players take roughly 30% of all shots (27.7% to be exact). The straight black line represents what the graph would look like if shot distribution were perfectly equal (i.e., every player takes the same number of shots).
How far apart the straight black line and the red curve are is represented by the Ballhog Coefficient. Its range is from zero to one, with zero representing perfect equality (the black line), and one representing perfect inequality (one player takes all the shots). Last year, the NBA's Ballhog Coefficient was 0.48.
[Before continuing, I want to emphasize that perfectly equitable shot distribution is definitely not an ideal scenario, unless you want Joey Dorsey taking as many shots as James Harden. The perfect equality line is only there for reference. It is not a recommendation.]
On an individual team level, here was every team's Ballhog Coefficient last year.

Shot distribution during crunch time, defined as 3 minutes or less down by 5 points or less or tied, however, is different. It looks like this.
 Compared to the total curve, the crunch time curve is even farther away from the perfect equality line, meaning shot distribution during crunch time was much less equitably distributed than it was in total. No one should be surprised. The top 10% of players, who shot 27.7% of all shots in total, shot 42.0% of all shots during crunch time. The Ballhog Coefficient during crunch time last year was 0.64, compared to 0.48 in total. That's a pretty dramatic change. Here's how each team, represented by a dot, shifted in its Ballhog Coefficient from total time to crunch time.

Again, the change is immediately perceptible. Only two teams did not increase their Ballhog Coefficient (Chicago Bulls, Cleveland Cavaliers). Here's the team list, sorted by their crunch time Ballhog Coefficient.

Expectedly, teams with the highest crunch time Ballhog Coefficients are also the teams with glamorous individual superstars (Dallas Mavericks, New York Knicks, and OKC Thunder). At the bottom are the starless teams (Denver Nuggets, Chicago Bulls), and the annoyingly platonic San Antonio Spurs.
Let's now analyze how this less equitable distribution of shots correlates with offensive production. First, we have this.
| Ballhog Coefficient | Offensive Rating | |
| Total | 0.48 | 104.0 |
| Crunch Time | 0.64 | 99.2 |
League-wide, offensive rating drops during crunch time as Ballhog Coefficient rises. In other words, as shot distribution becomes less equitable, offensive production becomes less efficient. This is, however, only one way of looking at it. Since different teams had different amounts of crunch time minutes played, league-wide results are skewed by teams who played a lot of close games. At a team level, here's what the results look like.
 This graph plots change in Ballhog Coefficient against change in offensive rating, from total to crunch time, for each team, represented by a dot. Just counting the dots reveals that only 10 teams increased their offensive efficiency during crunch time, meaning 2/3 of the league decreased in efficiency as their number of shot takers dwindled. And while not as dramatic as the league-wide results, there is still a weak negative correlation, represented by the blue trend line. On a team level, this suggests that the less equitably shots are distributed (relative to the team's average), the less offensively efficient the team becomes (relative to the team's average).
So while we might focus on Nick Young's crunch time shot going in, what we should focus on is that his 30-foot 3-point heave while he was unbalanced on all three axes of his body and Manu Ginobili was close enough to count his neck hairs was actually a horrific shot to take. But that's what happens during crunch time.